Problem 1. The period T seconds of a simple pendulum of length L cm satisfies the equation

for some positive constant α. Experimental measurements yielded the following results.
| L (cm) | 20 | 30 | 40 | 50 | 60 | 70 |
| T (s) | 0.89 | 1.10 | 1.26 | 1.41 | 1.55 | 1.67 |
Draw a straight-line graph of T2 against L. Hence, estimate the value of α.
(Click for Solution)
Solution. We first plot the values as follows, correct to the nearest 0.025 for the T2-axis.
| L | 20 | 30 | 40 | 50 | 60 | 70 |
| T2 | 0.800 | 1.200 | 1.600 | 2.000 | 2.400 | 2.800 |
Squaring both sides, T2 = α2 · L. Hence, we graph as follows.
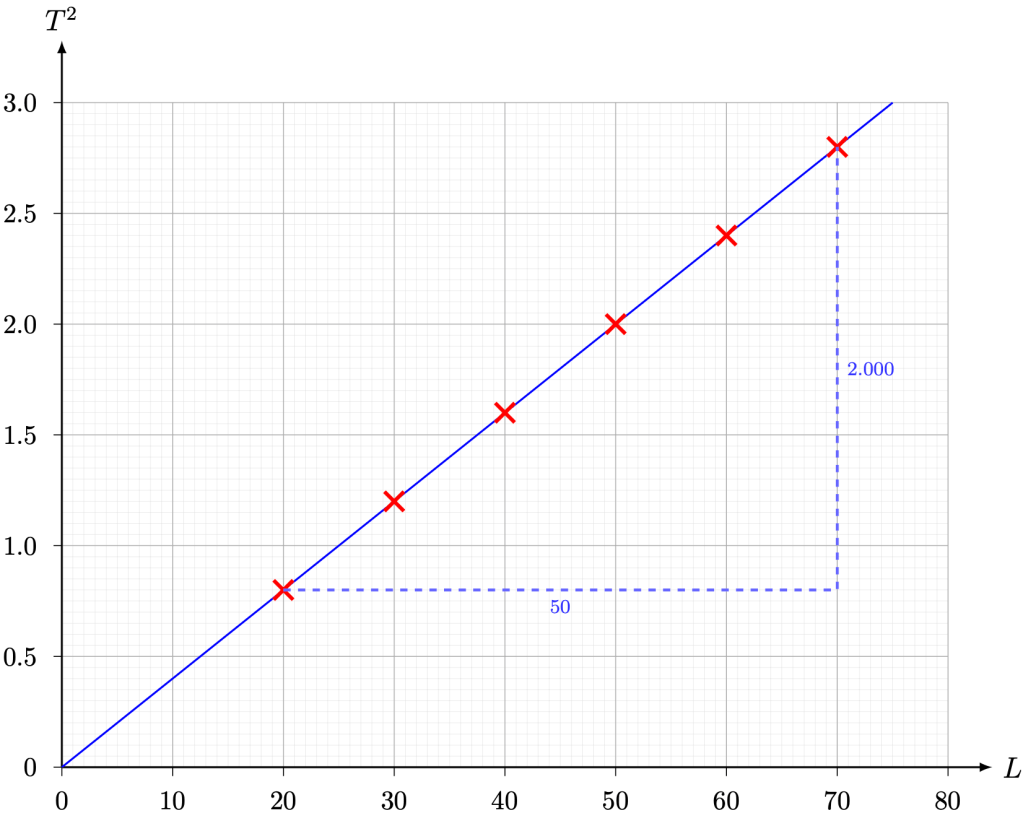
We estimate the gradient of the straight-line graph by

Taking square roots, α ≈ 0.2.
Problem 2. For a thin converging lens with focal length f cm, the object distance u cm and the image distance v cm are related by

The following values were obtained in an experiment
| u (cm) | 20 | 25 | 30 | 40 | 50 | 60 |
| v (cm) | 60.0 | 37.5 | 30.0 | 24.0 | 21.4 | 20.0 |
Draw a straight-line graph of 

(Click for Solution)
Solution. We first plot the values as follows.
| 1/u | 0.0500 | 0.0400 | 0.0335 | 0.0250 | 0.0200 | 0.0165 |
| 1/v | 0.0165 | 0.0265 | 0.0335 | 0.0415 | 0.0465 | 0.0500 |
Shifting 1/u to the right,

Hence, we graph as follows.
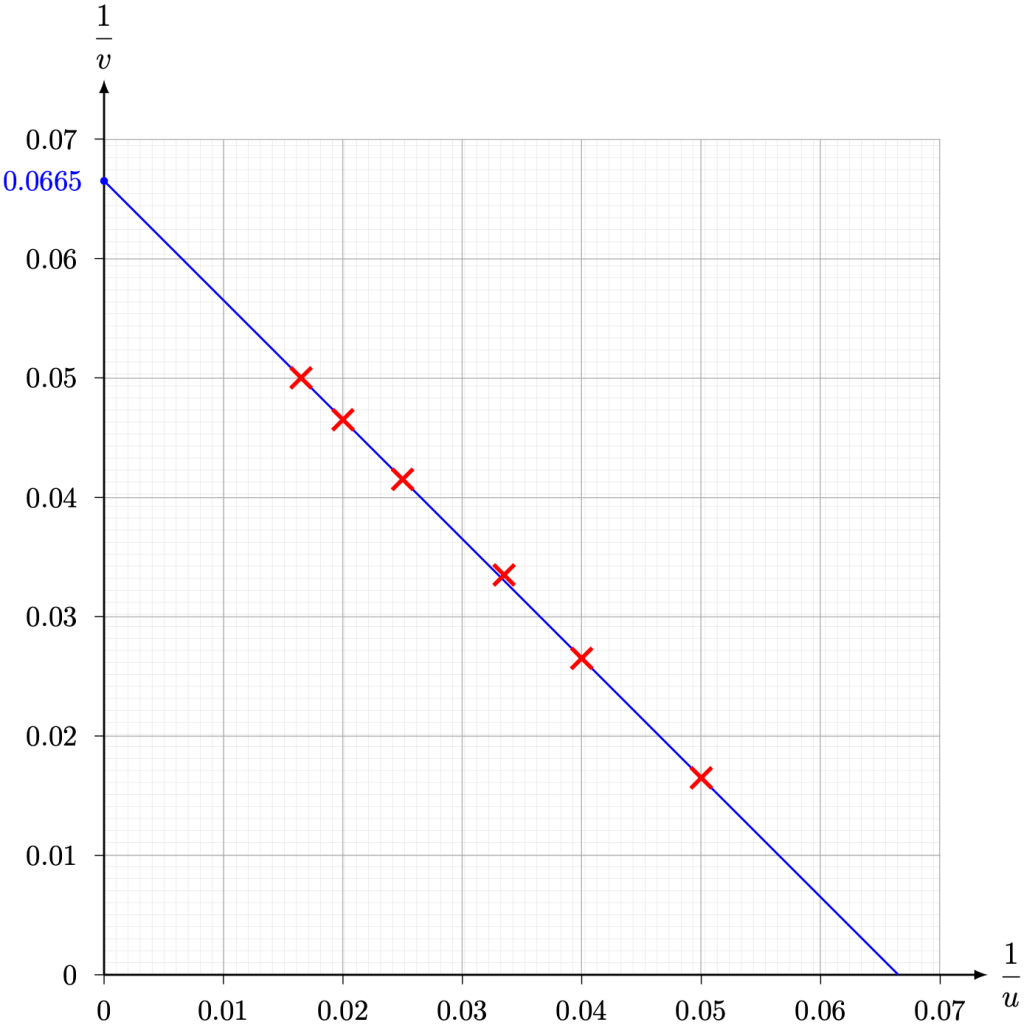
We estimate the (1/v)-intercept of the straight-line graph by

Problem 3. The population P of a city is modelled by

where t is the time in years after a reference year and A, k are positive constants. The following data was recorded.
| t (years) | 5 | 10 | 15 | 20 |
| P | 1778 | 3162 | 5623 | 10 000 |
Draw a straight-line graph of lg P against t. Hence, estimate the values of A and k.
(Click for Solution)
Solution. We first plot the values as follows.
| t | 5 | 10 | 15 | 20 |
| lg P | 3.250 | 3.500 | 3.750 | 4.000 |
Taking logarithms on both sides,

Hence, we graph as follows.
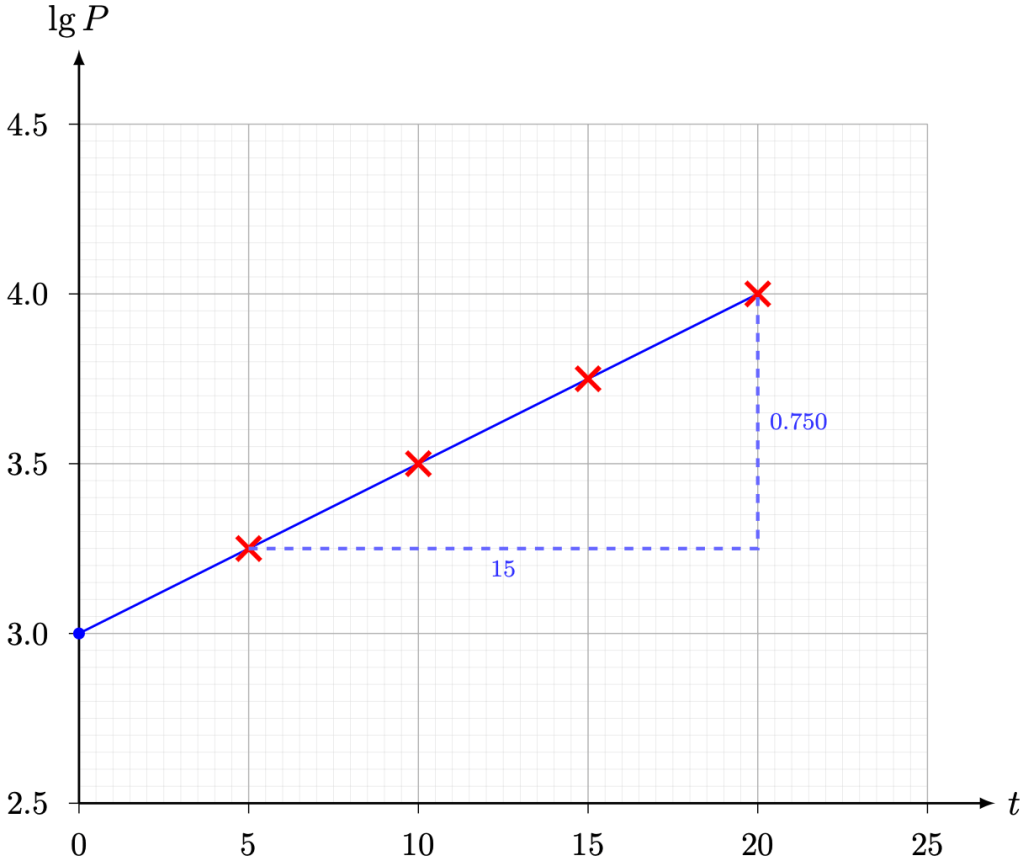
We estimate the gradient of the straight-line graph by

Taking exponentials, A ≈ 103 = 1000.
Problem 4. In a second-order chemical reaction, the concentration x units of a reactant at time t seconds satisfies the equation

where k is the rate constant and x0 is the initial concentration. The following data was recorded.
| t (s) | 2 | 4 | 6 | 8 | 10 |
| x (units) | 0.455 | 0.417 | 0.385 | 0.357 | 0.333 |
Draw a straight-line graph of 
(Click for Solution)
Solution. We first plot the values as follows.
| t | 2 | 4 | 6 | 8 | 10 |
| 1/x | 2.200 | 2.400 | 2.600 | 2.800 | 3.000 |
Hence, we graph as follows.
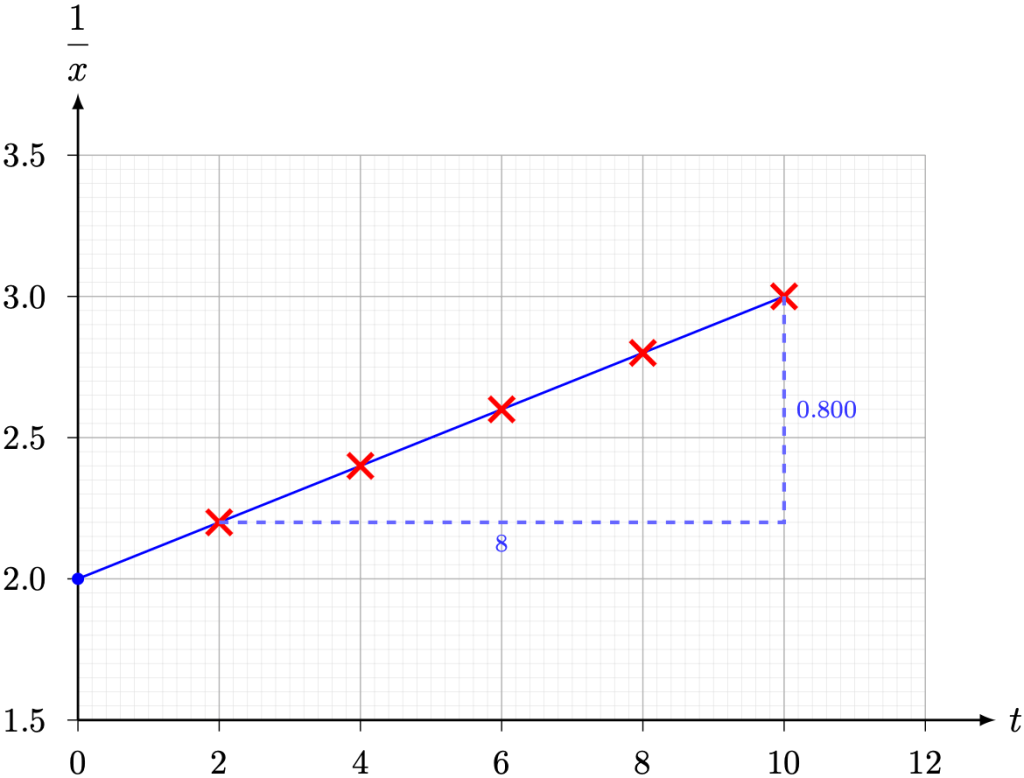
We estimate the gradient of the straight-line graph by

Taking reciprocals, x0 ≈ 1/2.0 = 0.5.
—Joel Kindiak, 7 Apr 26, 1808H

Leave a comment