Problem 1. A budget airline’s call centre logs the number of customer complaints received each working day over 20 consecutive days. The counts for the 20 days, in ascending order, are presented in a stem-and-leaf diagram below.

Legend: 1 | 6 represents 16 complaints
Represent the data using a box-and-whisker diagram.
(Click for Solution)
Solution. We first calculate Q0 = 16, Q4 = 52, and
Q2 = 0.5 × (31 + 33) = 32.
Furthermore,
Q1 = 0.5 × (26 + 27) = 26.5 and Q3 = 0.5 × (37 + 38) = 37.5.
Therefore, we draw the box-and-whisker diagram as follows.
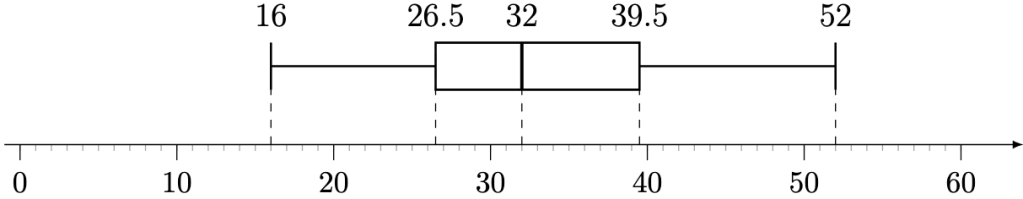
Number of complaints
Problem 2. A retail bank records the value ($) of every cash withdrawal made at its ATMs over one business day. The results are presented in a histogram below.
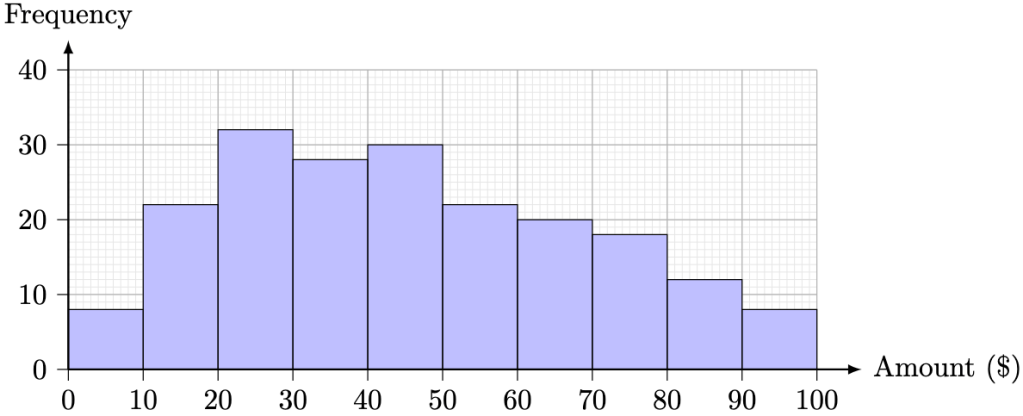
Estimate the mean and the standard deviation value of the withdrawals in that day.
(Click for Solution)
Solution. We tabulate the frequency with the proxy mid-value.
| Amount ($) | Frequency, f | Mid-value, x | fx | fx2 |
| 0 ≤ x < 10 | 8 | 5 | 40 | 200 |
| 10 ≤ x < 20 | 22 | 15 | 330 | 4950 |
| 20 ≤ x < 30 | 32 | 25 | 800 | 20 000 |
| 30 ≤ x < 40 | 28 | 35 | 980 | 34 300 |
| 40 ≤ x < 50 | 30 | 45 | 1350 | 60 750 |
| 50 ≤ x < 60 | 22 | 55 | 1210 | 66 550 |
| 60 ≤ x < 70 | 20 | 65 | 1300 | 84 500 |
| 70 ≤ x < 80 | 18 | 75 | 1350 | 101 250 |
| 80 ≤ x < 90 | 12 | 85 | 1020 | 86 700 |
| 90 ≤ x ≤ 100 | 8 | 95 | 760 | 72 200 |
| Sum, Σ | 200 | 9140 | 531 400 |
Hence, we compute the mean 


and

Problem 3. An online clothing retailer publishes the pictogram below to display quarterly sales on its investor webpage.
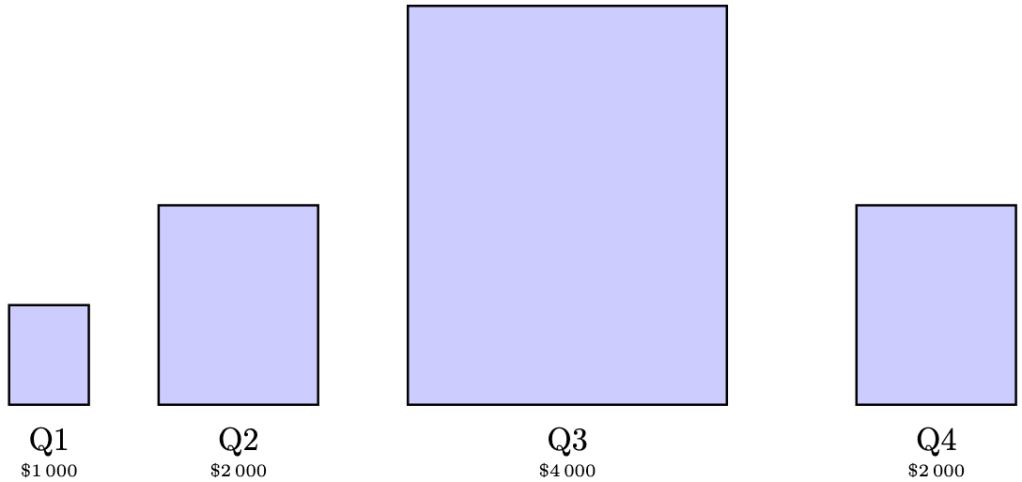
The sales in each quarter are denoted by the dollar amounts. Explain why the pictogram gives a misleading impression of the sales.
(Click for Solution)
Solution. Q3 has $4000 ÷ $1000 = 4 times the amount of sales as Q1, but is represented by a rectangle with area strictly larger than 4 times the area of the rectangle that represents Q1, misleading viewers that Q3’s earnings is more than 4 times the earnings of Q1.
Problem 4. An e-commerce logistics company tracks the average parcel delivery time (in days) each month. The data for one calendar year are presented in the line graph below.
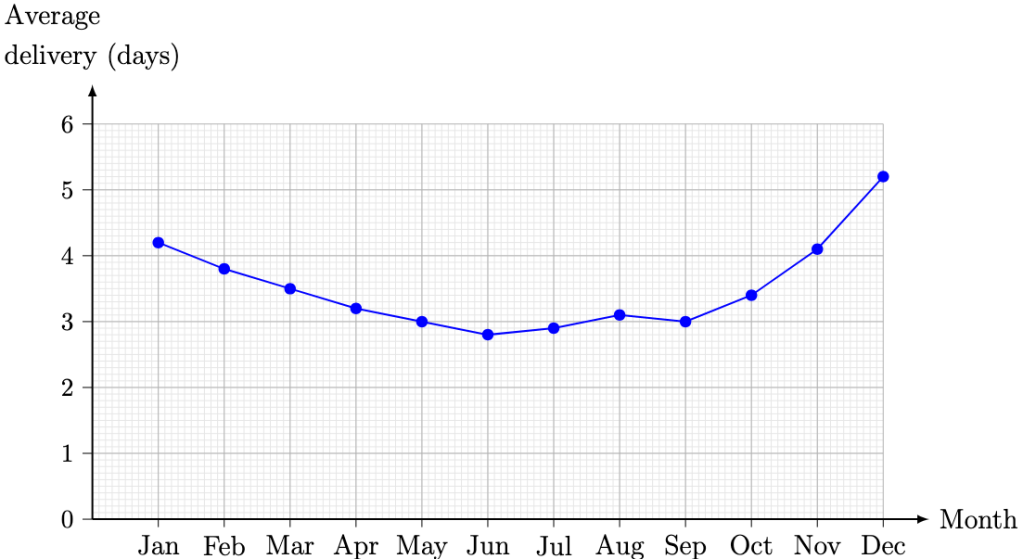
Estimate the percentage decrease in average delivery time from January to August.
(Click for Solution)
Solution. The average delivery time in January is 4.2 days, while the average delivery time in August is 3.1 days. Hence, the percentage change is given by

Hence, the percentage decrease is approximately 26.2%.
Problem 5. The pie chart below shows a country’s electricity generation by source for a given year.
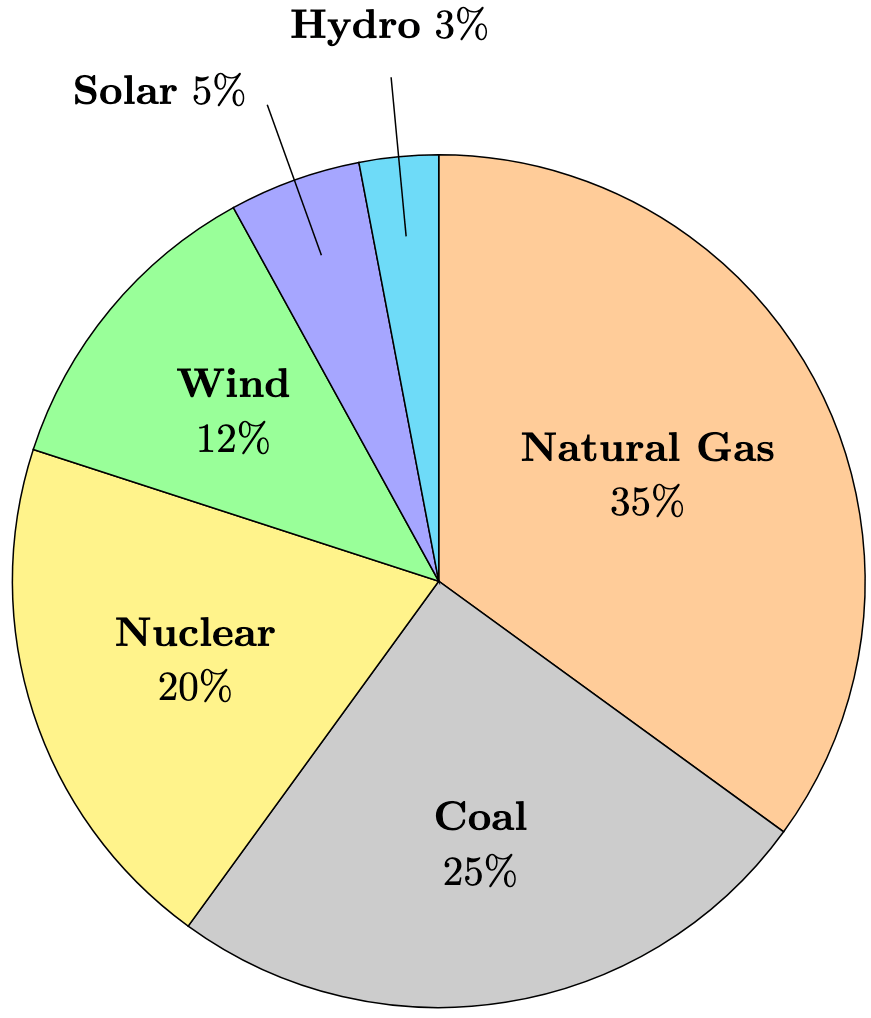
Calculate the angle of the sector that represents electricity generated by solar energy source.
(Click for Solution)
Solution. Since a full turn corresponds to 360°, 5% of a full turn corresponds to an angle of
5% × 360° = 0.05 × 360° = 18°.
—Joel Kindiak, 8 Apr 26, 1832H

Leave a comment