Problem 1. The speed-time graph of a particle moving in a straight line is shown below.
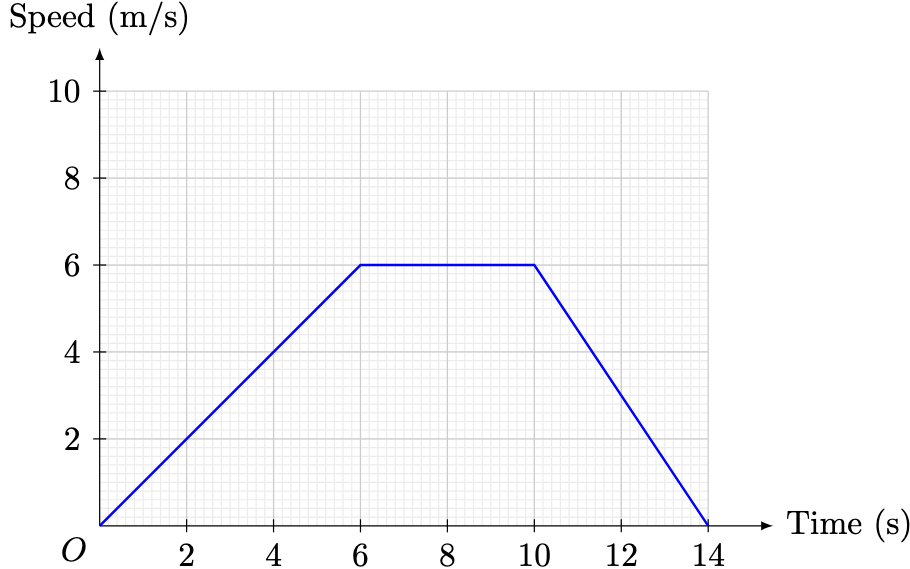
On separate diagrams, plot the corresponding distance-time graph and acceleration-time graph of the particle.
(Click for Solution)
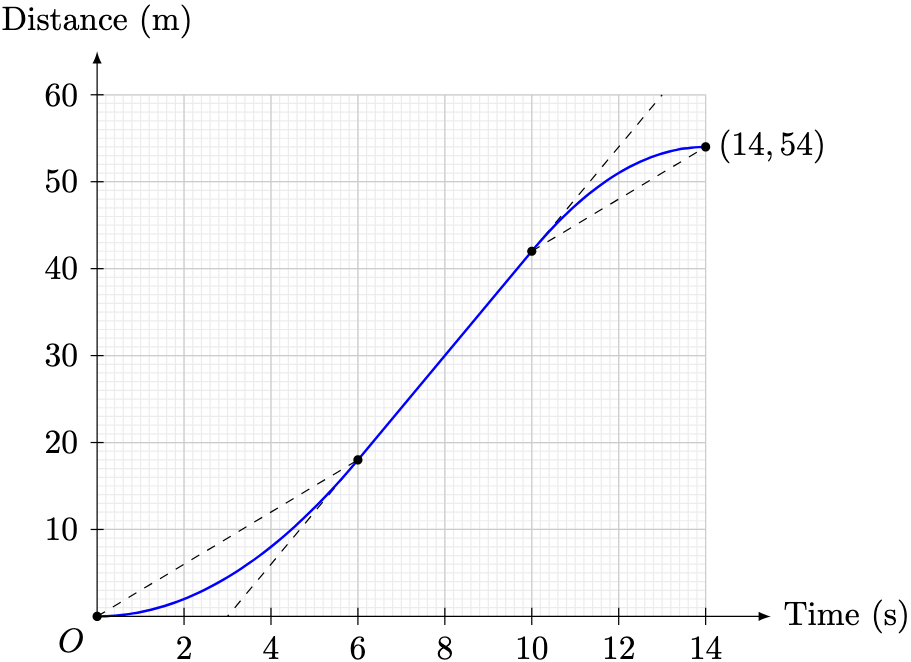
Solution. Let 


Therefore, we draw the distance-time graph as follows.
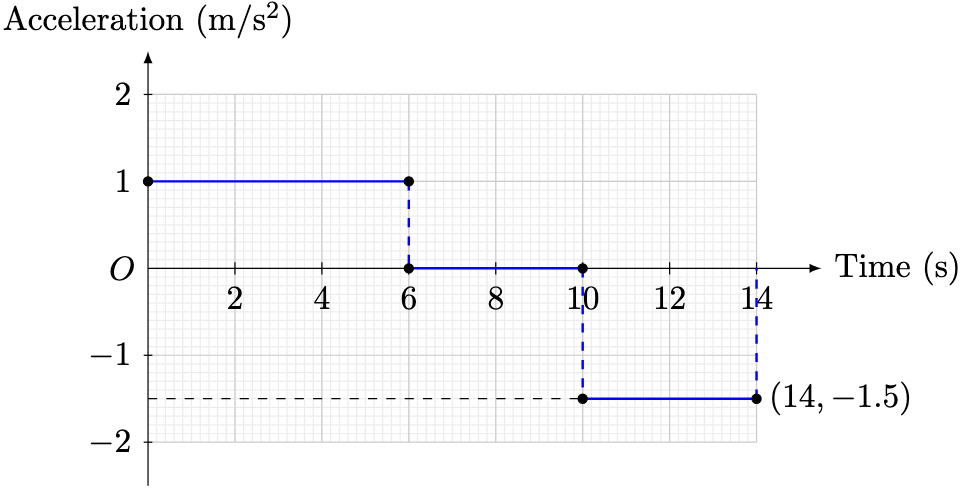
Let 

Therefore, we draw the acceleration-time graph as follows.
Remark 1. Using calculus, the shape of 

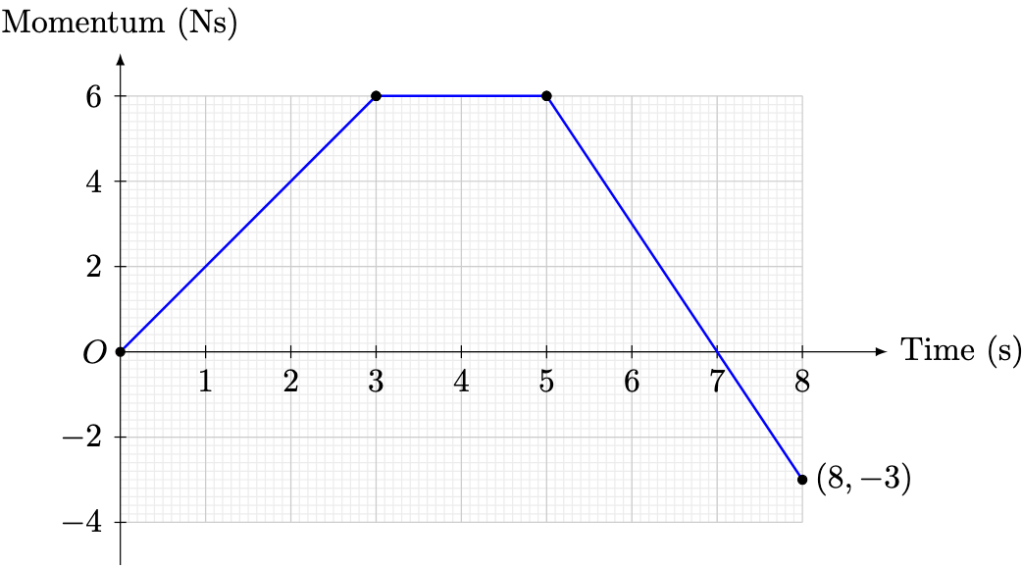
Problem 2. Newton’s second law states that the (net) force acting on an object is defined by the rate of change of its momentum.
The force-time graph for an object (initially at rest) is shown below.
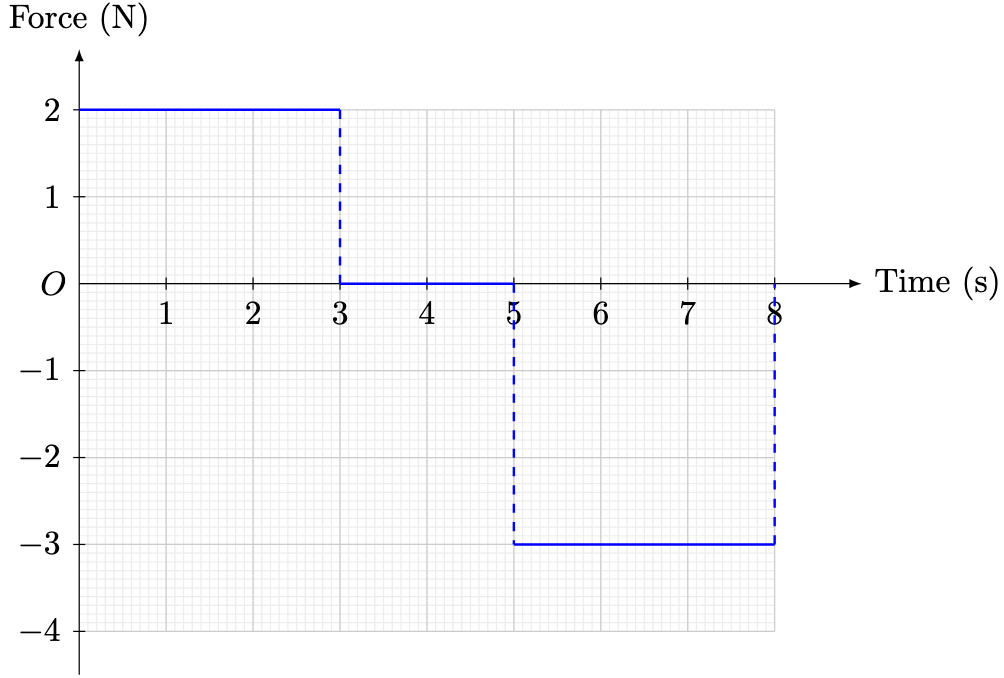
Plot the momentum-time graph of the object.
(Click for Solution)
Solution. Let 

Therefore, we draw the momentum-time graph as follows.
—Joel Kindiak, 9 Apr 26, 0017H

Leave a comment